作者原创,未经博主允许,不可转载
在前面分析和讲解了用java代码分别实现饼状图和折线图,在工作当中,也会遇到很多用ajax进行异步请求
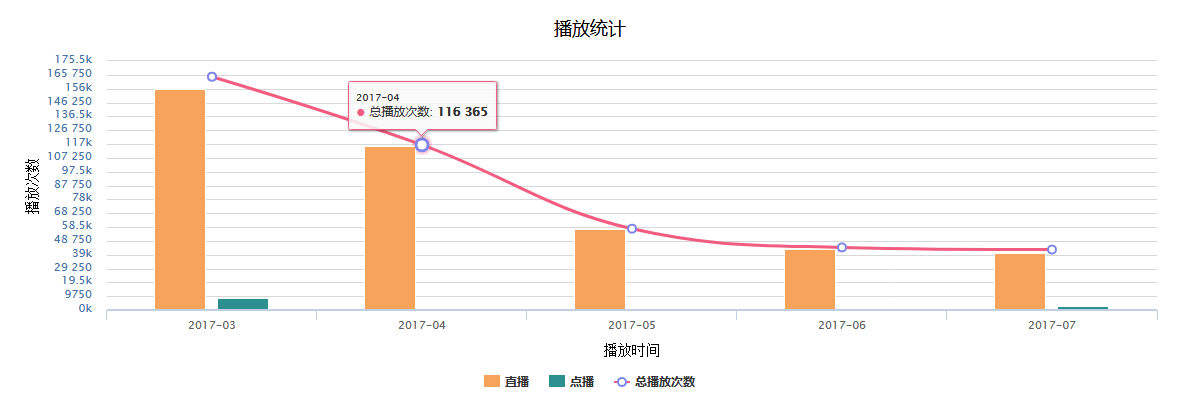
实现highchart。
先展示一下实现的效果图:
用ajax请求获取数据库后台数据,可以实现异步刷新的效果,其主要实现放在了js代码,即客户端实现请求,
这样可以减轻服务器端的压力。
先展示js处代码:
<!-- 播放统计柱型折线图 -->
<script type="text/javascript">var chart;$(function(){$.ajax({type:"post",cache: false,async: false,url:"<%=basePath%>personSpace/showPlayer",success:function(data){var data=eval(data);if(data.hasData>0){showBroadColumData(data);}else{$("#playStatistic").attr("src","images/playStatistic.png")var left=($(window).width()-1000)/2+"px";$("#playStatistic").css("margin-left",left);}}});});function showBroadColumData(data){var xCategory=[];var yData=[];var demandData=[];var splineData=[];for(var i=0;i<data.playCountInfo.length;i++){xCategory.push(data.playCountInfo[i].yearMonth);yData.push(parseInt(data.playCountInfo[i].livePlayCount));demandData.push(parseInt(data.playCountInfo[i].vodPlayCount));splineData.push(parseInt(data.playCountInfo[i].count));}chart = new Highcharts.Chart({chart:{renderTo:'broadColum'},title:{             text:'播放统计',style:{color:'#000',fontSize:'18px',fontFamily:"微软雅黑"}}, credits:{             enabled:false       }, xAxis:[{categories:xCategory,lineWidth:2,//自定义x轴宽度
          title: {text: '播放时间',style:{color:'black',fontSize:'14px',fontFamily:"宋体"}},style:{                     color:"#4572A7"                  }   }],yAxis:[{tickInterval:50,labels:{style:{                     color:"#4572A7"                  }      },title:{text: '播放次数',style:{color:'black',fontSize:'14px',fontFamily:"宋体"}}}],legend:{shadow:true,layout:"horizontal"},series:[{name:'直播',     type:"column",data:yData,color:Highcharts.getOptions().colors[3]},{name:'点播',     type:"column",data:demandData,color:Highcharts.getOptions().colors[7]},{name:'总播放次数',type:"spline",data:splineData,marker: {                                                     lineWidth: 2,                                               lineColor: Highcharts.getOptions().colors[4],               fillColor: 'white'                                          },color:Highcharts.getOptions().colors[5]      }]      });}</script>
其实现的思路为:先用ajax请求后台数据,从后台查询获取一个map的集合,然后将map中集合的数据遍历出来,将所需要的数据分别放入
不同的数组当中。,然后再将数组放入highchart插件当中。
此处展示java后台主要代码:
@ResponseBody
@RequestMapping(value = "/showPlayer", method = {RequestMethod.GET, RequestMethod.POST})
public Map<String, Object> showPlayerStatisticToBroad(HttpServletRequest request) {
List<PlayerStatisticsInfo> playerStatisticsInfos = new ArrayList<PlayerStatisticsInfo>();
playerStatisticsInfos = playerStatisticService.qryPlayCountInfo(getSessionInfo(request).getUserId()); //查询数据集合
Map<String, Object> map = new LinkedHashMap<String, Object>();//选择用map集合可以实现键值对形式,通过键值对的形式取得想要的数据和对象
if (CollectionUtils.isNotEmpty(playerStatisticsInfos)) {
map.put("playCountInfo", playerStatisticsInfos);
map.put("hasData", 1);
} else {
map.put("hasData", 0);
}
return map;
}